Why Your HubSpot Sales Forecast Is Wrong — and It's Not a Process Problem
Most forecasting failures are data failures, not process failures. Diagnose and fix the data foundation your HubSpot forecast depends on.

Peter Sterkenburg
HubSpot Solutions Architect & Revenue Operations expert. 20+ years B2B SaaS experience. Founder of HubHorizon.
Last month I sat in on a forecast review at a mid-market SaaS company. The VP of Sales ran two numbers: a weighted pipeline forecast of 1.8M and a bottom-up roll-up from manager calls of 1.2M. A 35% gap.
The CRO wanted to know which number was right. The answer, after 20 minutes of digging: neither. The weighted forecast was inflated because 40% of deals in the pipeline had no amount — HubSpot defaulted them to zero, but the stage probability still applied to deals that were clearly alive. The bottom-up was deflated because three managers hadn't submitted forecast categories for half their deals, so the roll-up only counted what was explicitly categorised.
Same pipeline. Same quarter. Same CRM. Two forecasting methods producing two wrong answers — not because the methods were flawed, but because the deal data underneath them was incomplete.
I keep seeing this pattern. Teams invest in forecasting processes, tools, cadences, and methodologies. They run the meetings, they buy the software, they restructure the review cycle. Then they feed those processes data that's 60% complete and wonder why the output is unreliable.
Forecasting is a data quality problem before it's a process problem. Fix the data foundation and your existing methodology — whatever it is — gets more accurate immediately.
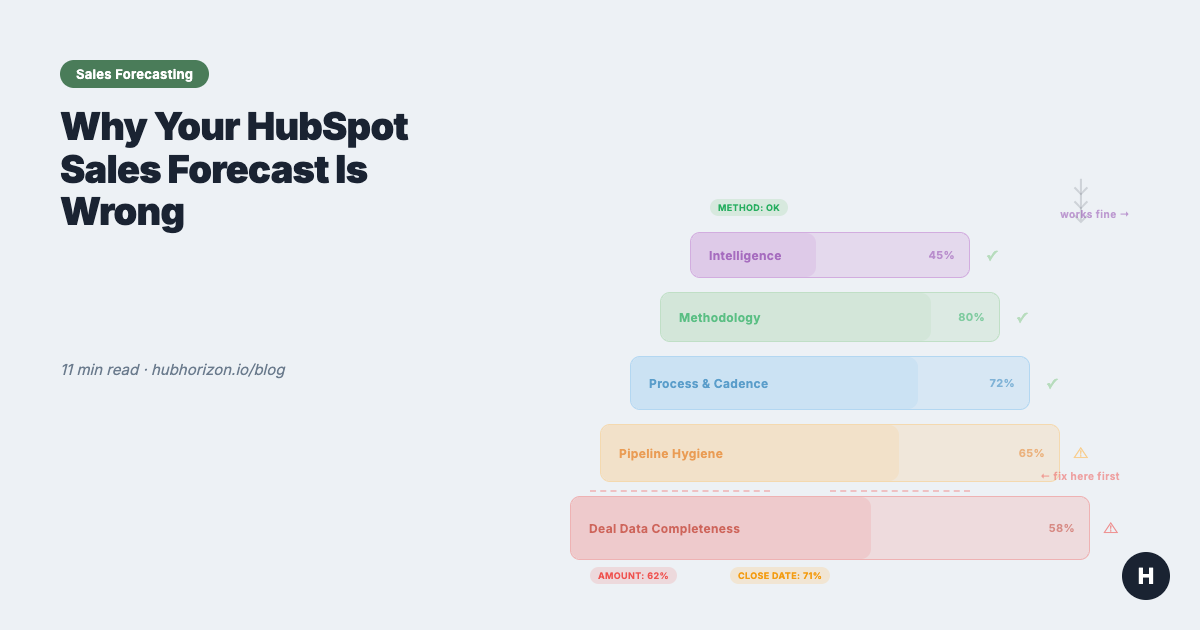
The forecasting data stack
Think of forecasting accuracy as a stack. Each layer depends on the one below it:
| Layer | What it is | What fails when it's weak |
|---|---|---|
| 5. Intelligence | AI projections, pattern detection, anomaly alerts | Predictions are confidently wrong |
| 4. Methodology | Weighted pipeline, bottom-up, blended | Right method, wrong output |
| 3. Process & cadence | Weekly reviews, submission deadlines, roll-up rhythm | Meetings without actionable data |
| 2. Pipeline hygiene | Deals in correct stages, amounts accurate, close dates current | Coverage ratios mean nothing |
| 1. Deal data completeness | Critical fields populated across all open deals | Everything above this is guesswork |
Most teams I work with start their forecasting improvement at Layer 3 or 4. They adopt a new methodology, install a forecasting tool, or restructure their weekly cadence. These are all reasonable things to do. But if Layers 1 and 2 are broken, the output of Layer 3 and 4 is still wrong — just wrong with more process around it.
The six data quality dimensions — accuracy, completeness, consistency, validity, uniqueness, timeliness — apply directly to deal data. A forecast built on deals with 60% field completeness and close dates that haven't been updated in three months is fiction, regardless of how sophisticated the methodology is.
Start at the bottom. Fix completeness first. Then hygiene. Then process. Then methodology. Then intelligence.
The 5 deal properties every forecast depends on
Every forecasting method — weighted, bottom-up, or AI — depends on the same small set of deal properties. When these are missing or stale, the method doesn't matter.
| Property | Why it matters for forecasting | What breaks without it | HubSpot implementation |
|---|---|---|---|
| Amount | Weighted forecast = probability x amount. Bottom-up uses amount for category totals. AI needs it for pattern matching. | Pipeline value is fiction. Coverage ratio is meaningless. Weighted forecast math produces zeros. | Require it when a deal enters a specific stage (e.g., "Qualified" or later). Use a workflow to flag late-stage deals with no amount. |
| Close date | Decides which forecast period a deal falls into. Drives pacing calculations. | Deals land in the wrong quarter. Pacing is off. You can't compare forecast vs. actual by period if close dates are fiction. | Track close date pushes. A deal whose close date has moved 3+ times is not closing on the date it currently shows. HubSpot tracks hs_date_entered_* timestamps per stage — use them to spot slippage patterns. |
| Deal stage | Drives probability in weighted forecasts. Defines where deals sit in your funnel. Stage conversion rates feed every pipeline health metric. | Weighted forecast uses wrong probabilities. Funnel analysis is meaningless. Reps park deals in stages that don't reflect reality. | Define exit criteria for each stage. What must be true for a deal to enter "Proposal Sent"? Write it down, train on it, audit it. Unclear exit criteria cause more stage inaccuracy than anything else I see in portals. |
| Forecast category | HubSpot's native field: Commit, Best Case, Pipeline, Omitted. This is what the bottom-up forecast tool aggregates. Managers adjust these during review calls. | The forecast tool shows partial data. Managers can't roll up by category. Bottom-up method is blind to uncategorised deals. | Use HubSpot's native forecast tool (Sales Hub Professional+). Make forecast category a required update during your weekly cadence. If a deal has no category, it's invisible to the forecast. |
| Deal owner | Roll-up by rep, team, and territory. Manager adjustments happen per-rep. Quota attainment tracks by owner. | You can't forecast by team or territory. Orphan deals (no owner) fall out of every roll-up. Manager review calls lack structure. | Auto-assign via workflow based on territory, company size, or round-robin. Audit monthly for deals with no owner or owners who've left the company. |
53% of sales teams report poor CRM data quality (Gartner). More than half of sales organisations are running their forecasts on incomplete deal data. The methodology isn't the bottleneck. The data is.
Three forecasting methods — and the data each one needs
Most forecasting guides present three methods: weighted pipeline, bottom-up, and AI-assisted. What they skip over is that all three fail the same way — when the deal data underneath is incomplete or wrong. The method matters less than the data feeding it.
Weighted pipeline forecast
How it works: Each deal stage has an assigned probability (e.g., Discovery 10%, Proposal 60%, Negotiation 90%). Multiply the deal amount by the stage probability, sum across all deals. That's your weighted forecast.
Data it needs: Accurate amounts on every deal. Deals in correct stages. Probabilities that reflect actual historical conversion rates — not the numbers someone guessed during initial setup.
Where it breaks in HubSpot:
- Missing amounts — HubSpot shows $0 for deals with no amount. The probability still applies, so these deals contribute nothing to the weighted total even though they're real opportunities. Your forecast is systematically understated.
- Stale probabilities — Most teams set stage probabilities once during pipeline setup and never update them. If your actual conversion from "Qualified" to "Closed Won" is 15% but the pipeline says 30%, your forecast is 2x overstated at that stage.
- Stage parking — Reps leave deals in stages that don't match reality. A deal in "Negotiation" at 90% probability that hasn't had activity in 45 days probably isn't at 90%.
HubSpot tip: Review and adjust your stage probabilities quarterly based on actual closed-won conversion rates. HubSpot's pipeline reports can show you real stage-to-close conversion rates. Use those, not the defaults.
Bottom-up (category-based) forecast
How it works: Reps assign each deal a forecast category: Commit (90%+ confidence), Best Case (50-89%), Pipeline (early stage), or Omitted (not in this period). Managers review, adjust, and roll up. The CRO gets a number built from human judgment, not just stage math.
Data it needs: Every deal with a forecast category assigned. Managers who actually review and adjust. A consistent cadence where this happens weekly or biweekly.
Where it breaks in HubSpot:
- Missing categories — Deals without a forecast category are invisible to the forecast tool. If 30% of your pipeline has no category, your bottom-up is missing 30% of your pipeline.
- Category inflation — Reps put deals in "Commit" without a close plan, a confirmed decision-maker, or a timeline. The category says 90%+ confidence, but the deal data says otherwise.
- No adjustment tracking — When managers adjust a rep's forecast, there's no audit trail unless you use a forecasting tool that tracks changes. Spreadsheet-based adjustments get lost.
HubSpot tip: Use HubSpot's native forecast tool (Sales Hub Professional or Enterprise). It handles category-based roll-up, allows manager adjustments, and shows changes over time. Make forecast category a required field update during your review cadence.
AI-assisted forecast
How it works: AI analyses historical deal data — close rates, deal velocity, amount changes, activity patterns — and generates a projected number. HubSpot's AI projections (Sales Hub Professional+) provide a forecast range with a midpoint.
Data it needs: At least 12 months of clean closed-won and closed-lost deal data. Consistent deal stages across that history. Activity data (emails, meetings, calls) logged against deals.
Where it breaks in HubSpot:
- Insufficient history — AI can't find patterns in six months of data across 50 deals. You need volume and time for statistical significance.
- Dirty historical data — If your past deals have inconsistent stages, missing amounts, or unreliable close dates, the AI learns from garbage. Garbage in, garbage out — except now with a confidence score attached.
- Process changes — If you restructured your pipeline stages, changed your sales motion, or entered a new market segment, historical patterns may not apply. The AI doesn't know your strategy changed; it just sees that patterns shifted.
HubSpot tip: Before turning on AI projections, clean your historical deal data. Make sure closed-won deals have accurate amounts, close dates, and stage progression. AI forecasting is a data readiness problem — clean inputs first, then the model becomes useful.
The common thread
All three methods fail when deal data is incomplete. Weighted forecasts with missing amounts understate. Bottom-up forecasts with missing categories have blind spots. And AI trained on dirty history is confidently wrong.
Fix the data first. Then the methodology works.
The forecast cadence — adapted for HubSpot
A forecast without a cadence is a number nobody acts on. The cadence is what turns it into a process — deals get inspected, categories get updated, the number sharpens each week.
The right cadence depends on your sales cycle:
By sales motion
| Sales motion | Cycle length | Forecast frequency | Why |
|---|---|---|---|
| SMB / high velocity | 7-30 days | Weekly | Deals move fast. A deal that enters Monday can close Friday. Weekly keeps pace. |
| Mid-market | 30-90 days | Weekly | Enough movement week-to-week to justify review. Most common cadence. |
| Enterprise | 90+ days | Biweekly | Deals don't change much week-to-week. Biweekly reduces meeting fatigue while catching slippage. |
Weekly operating cadence (mid-market example)
| Day | Who | Activity | HubSpot tool |
|---|---|---|---|
| Monday | Forecast tool | Lock previous week's snapshot. Send pacing report. | Forecast tool snapshots |
| Tuesday | RevOps | Analyse pipeline changes. Formulate questions for managers. Flag data quality issues. | Dashboards, deal board |
| Wednesday | Managers + Reps | Forecast call: inspect deals, update categories, adjust amounts and close dates. | Forecast tool, deal board |
| Thursday | Managers | Submit adjusted forecast. Note deal-level changes. | Forecast tool |
| Friday | CRO + Managers + RevOps | Forecast review: compare to target, discuss risk, agree on actions. | Forecast dashboard |
The RevOps role is the one most teams skip. RevOps isn't there to submit a number — they're there to challenge it. They spot deals that haven't moved in three weeks, amounts that changed without explanation, close dates that keep sliding. They're the data quality layer in the process.
If your team doesn't have a dedicated RevOps person, the sales manager absorbs this work. In theory. In practice, deal inspection always takes priority over data inspection, and nobody's checking whether the numbers going into the forecast are actually correct.
Pipeline coverage: the number behind the number
Pipeline coverage is the ratio of total pipeline value to your revenue target. A 3:1 ratio means you have three times your target in active pipeline. Most benchmarks recommend 3:1 to 5:1, depending on your win rate and average deal size.
Here's the problem: pipeline coverage is only meaningful if the pipeline data is accurate.
If 40% of your deals have no amount, your coverage ratio is based on 60% of your pipeline. The real ratio might be 30% higher than what the dashboard shows — or 30% lower, if the deals without amounts are small. You don't know, because the data isn't there.
If 25% of your deals have close dates in the past — deals that should have closed last quarter but didn't, and nobody updated the close date — those deals inflate your pipeline for the current period. Your coverage ratio includes deals that aren't actually in-period opportunities.
A 4:1 coverage ratio where 40% of deals are missing amounts and 25% have stale close dates could be anywhere from 2:1 to 6:1 in reality. The dashboard shows a number. Whether that number means anything depends entirely on the data underneath it.
Before you optimise your coverage ratio, fix the data that feeds it. Specifically:
- Populate amounts on all deals past the qualification stage
- Update close dates to reflect reality, not the original optimistic estimate
- Close or remove deals that are genuinely dead but still sitting in the pipeline
Then your coverage ratio means something. A clean 3.5:1 is more useful than a dirty 5:1.
Cross-link: Your HubSpot Portal Has a Revenue Leak covers how dirty pipeline data distorts every metric downstream, not just coverage.
Deal slippage: the silent forecast killer
Close date pushes tell you more about forecast accuracy than any methodology. A deal whose close date moves once — fine, normal adjustment. When it moves three or more times, that deal is not closing on the date it currently shows. Full stop.
Most sales teams don't track pushes systematically. The close date changes, the forecast shifts, and nobody asks how many times this deal has slipped.
How to detect slippage in HubSpot
HubSpot records when a deal enters each stage via hs_date_entered_[stagename] timestamp properties. You can't directly see "number of close date changes" without custom tracking, but you can identify slippage patterns:
- Overdue deals: Close date is in the past, deal is still open. These are deals where someone forgot to push the date — or gave up without closing the deal.
- Stage stagnation: Deal has been in the same stage for 2x your average cycle time for that stage. It's not moving. The close date is probably fiction.
- Late-stage parking: Deals in "Negotiation" or "Contract Sent" for 30+ days. If the contract was actually sent, it would have closed or died by now.
The business impact
Every deal that slips from this quarter to next quarter creates a double distortion: this quarter's forecast is overstated, and next quarter's pipeline is inflated with carry-over that may not close then either.
42% of sales teams still forecast in spreadsheets (Weflow pipeline data). In spreadsheet forecasts, slippage is invisible — you just see the current close date, not the history of changes. HubSpot's deal records preserve the history, but most teams don't build dashboards to surface it.
Build a dashboard for this. Track deals with close dates pushed more than twice. Review them explicitly in your forecast cadence. They need either a confirmed new close date with a real reason behind it, or they need to move to a later period. Or — and this is the one nobody wants to hear — they need to be closed as lost.
Diagnostic: is your HubSpot portal forecast-ready?
Answer these ten questions honestly. Each one maps to a data quality gap that will show up in your forecast numbers.
| # | Question | Healthy | Warning | Why it matters |
|---|---|---|---|---|
| 1 | What % of open deals have an amount? | >90% | <70% | Weighted forecast math requires amounts. Missing = invisible revenue. |
| 2 | What % of deals have a forecast category? | >85% | <60% | Bottom-up forecast only sees categorised deals. The rest are ghosts. |
| 3 | How many deals have close dates in the past? | <5% of open deals | >15% | Past-due close dates inflate current pipeline and distort period allocation. |
| 4 | What's the average number of close date pushes? | <2 per deal | >3 per deal | Frequent pushes = close date is fiction. Forecast period is wrong. |
| 5 | What % of deals are associated to contacts AND companies? | >85% | <60% | Unassociated deals can't be forecast by territory, segment, or account. |
| 6 | Are stage conversion rates defined and tracked? | Yes, reviewed quarterly | No / set once | Stale probabilities make weighted forecasts systematically wrong. |
| 7 | Do you know your pipeline coverage ratio? | Yes, tracked weekly | No / calculated manually | Can't assess forecast risk without knowing how much pipeline backs the target. |
| 8 | Is there a forecast review cadence? | Weekly or biweekly | Ad hoc or none | Without cadence, forecast categories go stale. Bottom-up method collapses. |
| 9 | Are historical win rates by stage available? | Yes, last 12 months | No / estimated | AI forecasting and dynamic probabilities need historical data. |
| 10 | Are deal velocity benchmarks established? | Yes, per pipeline/segment | No | Can't detect stalled deals or predict close timing without velocity baselines. |
Score yourself: 8-10 healthy answers = your data foundation supports accurate forecasting. 5-7 = your forecast is probably directionally right but unreliable for commitments. Below 5 = your forecast is a guess with extra steps.
If you scored below 7, start with the data layer. Fix completeness (questions 1-5) before process (questions 6-10). Completeness fixes show results immediately. Process fixes only work when the data underneath is solid.
For a broader view beyond deal data, a CRM health score rolls these signals into a single composite metric. The data quality dimensions article breaks down what each dimension measures and how to improve it.
Frequently Asked Questions
Why is my sales forecast wrong?
Most forecast inaccuracy comes from data problems, not process problems. The top causes: incomplete deal amounts (HubSpot defaults to zero), stale close dates that haven't been updated, missing or inconsistent forecast categories, and pipeline hygiene issues like deals sitting in stages past their average cycle time. Fix the data layer first — your existing methodology will get dramatically more accurate.
What deal data does a forecast need to be accurate?
Five properties are non-negotiable: deal amount, close date, deal stage, forecast category, and deal owner. Each must be populated and current. Beyond these, accurate forecasting benefits from activity data (last touch date, next step), historical win rates by stage, and pipeline velocity metrics. If any of the core five are missing on more than 20% of open deals, your forecast is unreliable.
How do you improve HubSpot forecast accuracy?
Start with data completeness: ensure all open deals have amount, close date, and forecast category populated. Then enforce timeliness: make reps update close dates and stages weekly. Next, establish pipeline hygiene rules — flag deals that exceed 1.5x your average cycle time, have no activity in 14+ days, or are missing associated contacts. These three fixes typically improve forecast accuracy by 15-25 percentage points.
What is the difference between weighted pipeline and forecast categories in HubSpot?
Weighted pipeline multiplies deal amounts by stage-based probabilities (e.g., "Proposal Sent" = 60% probability). Forecast categories use human judgement — reps classify deals as Commit, Best Case, Pipeline, or Omit. Weighted pipeline is automated but dumb; it applies the same probability regardless of deal context. Forecast categories incorporate rep knowledge but depend on consistent human input. The best forecasts use both, with categories overriding weighted numbers for committed deals.
Automate the diagnosis
Everything above can be done manually. Pull deal reports, calculate fill rates, count close date pushes, compute coverage ratios. It works. It takes a couple of days per quarter for a portal with a meaningful pipeline.
Or you can skip the spreadsheet archaeology. HubHorizon runs the diagnostic automatically — forecasting readiness score, pipeline health dashboard, deal slippage analysis, coverage calculations, and accuracy tracking over time. Connect your portal, get scores in minutes, spend your time on fixes instead of discovery.
Get your free forecasting readiness analysis at hubhorizon.io — 30 seconds to connect, 5 minutes to your first score. No credit card. Pricing plans cover continuous monitoring and exportable reports.
Peter Sterkenburg built HubHorizon after years in scale-up RevOps — running the forecast calls, staring at the pipeline gaps, and eventually building the diagnostic tool he wished someone else had made.
Related articles
The HubSpot Pipeline Management Cheat Sheet: Views, Signals, and Reviews in One Place
One-page HubSpot pipeline reference: 6 deal health signals, warning thresholds, 9 saved view recipes, stage design checklist, and review prep guide.
Read articleYour HubSpot Pipeline Is a Data Structure. Most Are Broken.
Your deal pipeline is a data structure. When stages, exit criteria, and required properties break, forecasting and AI produce garbage. Diagnose and fix it.
Read articleThe HubSpot Sales Forecasting Cheat Sheet: Data, Process, and Pipeline in One Place
One-page HubSpot forecasting reference: 5 key deal properties, 3 methods compared, cadence templates, pipeline benchmarks, and a 10-question diagnostic.
Read article