The HubSpot Pipeline Management Cheat Sheet: Views, Signals, and Reviews in One Place
One-page HubSpot pipeline reference: 6 deal health signals, warning thresholds, 9 saved view recipes, stage design checklist, and review prep guide.

Peter Sterkenburg
HubSpot Solutions Architect & Revenue Operations expert. 20+ years B2B SaaS experience. Founder of HubHorizon.
Why pipeline health is a data problem
Your pipeline isn't a sales visualisation. It's a data structure — and when it's broken, every downstream process lies. The full guide makes the case in depth. This cheat sheet gives you the reference tables.
The pattern repeats in every portal: deals stuck in stages they shouldn't be in, close dates from three months ago, "Negotiation" deals with zero activity. The pipeline looks full. The forecast is fiction. Pipeline reviews become status updates instead of problem-solving sessions.
Fix the signals first. Then the views. Then the reviews.
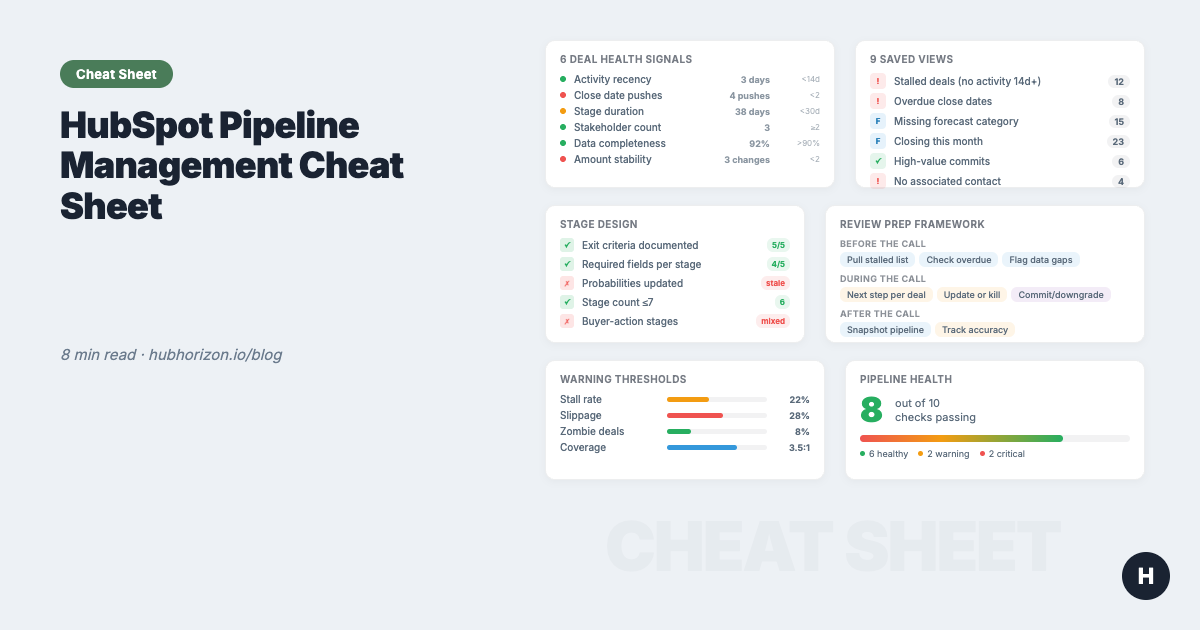
The 6 deal health signals
Every healthy deal shows these six signals. When signals drop, the deal is at risk — regardless of what stage it's in or what the rep says about it.
| Signal | What to look for | HubSpot check | Healthy | Warning | Critical |
|---|---|---|---|---|---|
| Next step exists | Scheduled future commitment | hs_next_activity_date populated |
Within 14 days | >14 days or vague | No next activity |
| Activity velocity | Frequency + recency of touchpoints | Deal timeline activity count, last activity date | 2+/week, last <7 days | <1/week, last 7-14 days | No activity >14 days |
| Multi-threading | Multiple buyer contacts engaged | Associated contacts count + roles | 3+ contacts with roles | 2 contacts, no roles | Single contact |
| Access to power | Decision-maker involved | Contact role = "Decision Maker" in recent activities | Active in last 2 weeks | Listed but not active | Not identified |
| Stage velocity | Time in stage vs. benchmark | hs_date_entered_[stage] or days since entry |
Below average | 1-1.5x average | >1.5x average |
| Close date stability | How often close date moved | Custom counter property or manual check | 0-1 pushes | 2 pushes | 3+ pushes |
These signals are independent. A deal can have great activity velocity (Signal 2) but no decision-maker engaged (Signal 4). Checking one or two signals misses the picture. All six together tell you whether a deal is real.
For the reasoning behind each signal and how to interpret them, see the full pipeline health guide.
Pipeline warning thresholds by sales cycle
When a deal triggers one of these thresholds, it needs attention. Thresholds vary by how fast your sales motion runs.
| Warning | Short cycle (<45 days) | Mid-market (45-90 days) | Enterprise (90+ days) |
|---|---|---|---|
| No activity | 7 days | 14 days | 21 days |
| Stalled in stage | 10 days | 20 days | 30 days |
| Ghosted (no inbound from prospect) | 4 days | 7 days | 14 days |
| Close date pushed | 2+ times | 2+ times | 3+ times |
| Cycle length exceeded | >1.5x average | >1.5x average | >1.5x average |
| Overdue close date | Any deal past close date | Any deal past close date | Any deal past close date |
| Single-threaded | Only 1 associated contact | Only 1 associated contact | Only 1 associated contact |
HubSpot implementation: Build a multi-checkbox property called "Deal Warnings." Create workflows that check each condition and add the matching warning value. Filter saved views by this property to surface at-risk deals before every review.
9 HubSpot saved view recipes
These views cover the core pipeline management use cases. Each one uses HubSpot-native filters, columns, sorting, and grouping. Build them once, assign to your team.
1. My Deals This Quarter
Purpose: Personal pipeline focus for reps. See your open deals closing this quarter with risk indicators.
| Setting | Value |
|---|---|
| Filters | Owner = Me, Close Date = This Quarter, Stage = all open stages |
| Columns | Deal Name, Close Date, Amount, Stage, Time in Stage, Last Activity Date, Next Activity Date, Deal Age |
| Sort | Close Date (ascending) |
| Group by | — |
2. Deal Hygiene
Purpose: Surface deals with missing or stale data. The cleanup view.
| Setting | Value |
|---|---|
| Filters | Stage = all open stages, Close Date = This Quarter + Next Quarter |
| Columns | Deal Name, Owner, Amount, Close Date, Stage, Associated Contacts, Last Activity Date, Next Activity Date |
| Sort | Last Activity Date (ascending) — stalest deals first |
| Group by | Owner |
What to look for: Deals with $0 amount, no associated contacts, close date in the past, no activity in 14+ days.
3. Deal Review
Purpose: Manager's inspection view for structured pipeline reviews. Shows health indicators at a glance.
| Setting | Value |
|---|---|
| Filters | Close Date = This Quarter, Stage = all open stages, Owner = select team |
| Columns | Deal Name, Amount, Close Date, Stage, Time in Stage, Deal Age, Last Activity Date, Forecast Category, Associated Contacts |
| Sort | Close Date (ascending), then Amount (descending) |
| Group by | Owner |
4. Expansion Pipeline
Purpose: Track upsell and cross-sell deals separately from new business.
| Setting | Value |
|---|---|
| Filters | Pipeline = Expansion (or Deal Type = "Existing Business"), Stage = all open stages, Close Date = This Quarter |
| Columns | Deal Name, Company, Amount, Close Date, Stage, Time in Stage, Owner, Deal Age |
| Sort | Close Date (ascending), Amount (descending) |
| Group by | Owner |
HubSpot note: If you don't have a separate expansion pipeline, use Deal Type or a custom property to distinguish expansion from new logo deals.
5. Renewal Pipeline
Purpose: Track renewals approaching close. Catch at-risk renewals before they churn.
| Setting | Value |
|---|---|
| Filters | Pipeline = Renewals (or Deal Type = "Renewal"), Close Date = This Quarter + Next Quarter, Stage = all open stages |
| Columns | Deal Name, Company, Amount, Close Date, Stage, Next Activity Date, Owner, Time in Stage |
| Sort | Close Date (ascending) |
| Group by | Owner |
6. Next Quarter Pipeline
Purpose: Pipe generation health check. Is enough being built for next quarter?
| Setting | Value |
|---|---|
| Filters | Close Date = Next Quarter, Stage = all stages, Owner = all |
| Columns | Deal Name, Amount, Create Date, Stage, Owner, Deal Age, Next Activity Date |
| Sort | Create Date (descending), Amount (descending) |
| Group by | Owner |
What to review: Total pipeline value vs. next quarter target. Number of new deals created. Stage distribution — are they front-loaded in early stages or progressing?
7. Recently Created Deals
Purpose: Monitor deal creation velocity by rep and source. Are enough new deals entering the pipeline?
| Setting | Value |
|---|---|
| Filters | Create Date = Last 30 Days, Stage = all |
| Columns | Deal Name, Company, Create Date, Amount, Stage, Owner, Deal Source |
| Sort | Create Date (descending) |
| Group by | Owner |
8. Win/Loss Analysis
Purpose: Learn from closed deals. Identify patterns in what wins and what loses.
| Setting | Value |
|---|---|
| Filters | Stage = Closed Won + Closed Lost, Close Date = Last Quarter (or custom range) |
| Columns | Deal Name, Company, Amount, Close Date, Stage, Deal Age, Associated Contacts, Closed Lost Reason, Closed Won Reason, Owner |
| Sort | Close Date (descending), Amount (descending) |
| Group by | Stage (separates won from lost) |
What to review: Average deal size won vs. lost. Average cycle length won vs. lost. Common lost reasons. Activity count differences between won and lost deals.
9. Swing Deals
Purpose: Focus on high-value deals that will make or break quota. These get extra attention.
| Setting | Value |
|---|---|
| Filters | Amount > [your threshold, e.g. $50K], Stage = all open stages, Close Date = This Quarter |
| Columns | Deal Name, Company, Amount, Close Date, Stage, Time in Stage, Last Activity Date, Associated Contacts, Owner |
| Sort | Amount (descending) |
| Group by | Stage |
Threshold guidance: Set the amount filter to your top 20% of deal sizes. These are the deals where one slip costs the quarter.
Stage design checklist
Before a stage belongs in your pipeline, it should pass all four filters. Use this when building or auditing your deal stages.
- Required — would skipping this step meaningfully reduce the chance of winning?
- Factual — tied to a concrete, observable action (not a feeling or judgment call)
- Inspectable — a manager can verify it by looking at the CRM (logged activity, property value, associated record)
- Buyer-centric — named from the buyer's perspective, not the seller's
Example stage progression
| Stage | Buyer-centric name | Exit criteria (what must be true) | Required properties |
|---|---|---|---|
| 1 | Appointment Scheduled | Buyer agreed to a discovery meeting. Calendar invite sent and accepted. | Close Date, Deal Owner |
| 2 | Product Explored | Buyer attended demo/discovery, got questions answered, agreed to next step. | Amount (estimated), Primary Contact |
| 3 | Solution Evaluated | Buying team assessed fit. Requirements documented. Decision criteria understood. | Decision Maker (contact role), BANT/MEDDICC fields |
| 4 | Proposal Reviewed | Buyer received and reviewed proposal. Pricing discussed. Timeline confirmed. | Amount (final), Proposal Date |
| 5 | Contract Received | Buyer received contract. Legal/procurement engaged. Close plan documented. | Expected Close Date (confirmed) |
| 6 | Closed Won | Contract signed and returned. | Closed Won Reason |
| 7 | Closed Lost | Buyer explicitly declined or went dark beyond threshold. | Closed Lost Reason |
Adapt to your sales motion. The point isn't to copy these stages — it's to apply the four filters to your own process and trim until every stage earns its place.
For the full stage design framework including naming conventions and probability calibration, see the pipeline health guide.
Pipeline review prep — 5-point deal inspection
Before every pipeline review, check these five data points on each flagged deal. This takes 60 seconds per deal with the right saved view.
- Close date — Current, overdue, or pushed? How many times has it moved?
- Time in stage — Within normal range, or stalled? Compare to your average.
- Next activity — Is there a scheduled next step? When?
- Activity recency — When was the last bi-directional activity?
- Contact coverage — How many contacts associated? Is a decision-maker identified?
The one question worth asking every time: "What specifically must happen for this deal to move to the next stage?" If the answer is vague, the deal isn't where the pipeline says it is.
Pipeline health benchmarks
| Metric | How to calculate | Healthy | Warning | Critical |
|---|---|---|---|---|
| Pipeline coverage | Total open pipeline / revenue target | 3:1 - 5:1 | 2:1 - 3:1 | <2:1 |
| Stage conversion rate | Deals progressing to next stage / total in stage | Tracked quarterly, improving | Tracked but flat | Not tracked |
| Average stage velocity | Days per stage (by pipeline segment) | Known and used for stall detection | Known but not actioned | Unknown |
| Stall rate | % of deals exceeding 1.5x avg stage duration | <15% | 15-25% | >25% |
| Deal data completeness | % of open deals with all required fields | >90% | 70-90% | <70% |
| Win rate | Closed Won / (Won + Lost) by segment | Known by segment and rep | Known overall only | Unknown |
| Overdue deals | % of open deals with close date in the past | <5% | 5-15% | >15% |
| Single-threaded rate | % of deals with only 1 associated contact | <20% | 20-40% | >40% |
Coverage and win rate depend on the same data quality foundation. A 5:1 coverage ratio with 40% of deals missing amounts is not really 5:1 — it's an unknown ratio with a confident-looking number. The forecasting cheat sheet covers this in detail.
Is your pipeline healthy? 10-question diagnostic
Answer honestly. Each question maps to a specific pipeline health gap.
- 1. Stage definitions: Every deal stage has written exit criteria that pass the 4-filter test
- 2. Required properties: At least Amount, Close Date, and Primary Contact are required at relevant stage gates
- 3. Deal hygiene: <5% of open deals have a close date in the past
- 4. Activity coverage: >80% of open deals had logged activity in the last 14 days
- 5. Contact associations: >85% of deals are associated to 2+ contacts
- 6. Decision-maker mapping: >60% of deals past qualification have a Decision Maker contact role
- 7. Stage velocity: You know your average time-in-stage per pipeline stage and review it quarterly
- 8. Warning system: Automated warnings (workflow or saved view) flag stalled, ghosted, and overdue deals
- 9. Review cadence: Structured pipeline reviews happen weekly or biweekly with a defined triage process
- 10. Win/Loss analysis: Closed deals are reviewed monthly with lost reasons tracked and patterns identified
8-10 checked: Your pipeline is well-structured and actively managed. Focus on coaching and optimisation.
5-7 checked: Your pipeline works but has gaps. Prioritise stage definitions (Q1-2) and warning systems (Q8) — they improve everything else.
Below 5: Your pipeline is a list of deals, not a managed process. Start with the full pipeline health guide and fix the architecture before adding process.
For the broader CRM health view beyond deals, a CRM health score aggregates signals across all objects. And for data quality foundations, the data quality dimensions framework applies to every property in every object.
Related resources
| Resource | What it covers |
|---|---|
| Your HubSpot Pipeline Is a Data Structure | Full guide: pipeline as data architecture, 6 health signals in depth, stage design, reviews |
| Why Your HubSpot Sales Forecast Is Wrong | The forecasting data stack, methodology comparison, cadence design |
| The HubSpot Sales Forecasting Cheat Sheet | 5 deal properties, forecast categories, cadence templates, benchmarks |
| The HubSpot Data Hygiene Cheat Sheet | Data quality across all objects: 6 dimensions, object-level best practices |
| Your HubSpot Portal Has a Revenue Leak | Orphan records, property sprawl, broken associations, report distrust |
| CRM Health Scores Explained | Composite health scores: what they measure and how to improve them |
| HubSpot Data Quality Audit Guide | 10-area audit checklist for HubSpot portals |
| RevOps Maturity Model | 5-level maturity framework: where does your portal stand? |
| Building a Unified Customer View | Why associations matter: deals, contacts, companies connected |
| AI Readiness for HubSpot | Data requirements for Breeze AI, including deal-level signals |
Automate the diagnostic
Everything above can be done manually — set up saved views, build warning workflows, audit stages, run structured reviews. It works. It takes discipline and consistent time, which is the resource most RevOps teams are shortest on.
HubHorizon automates the diagnostic layer. Connect your portal and get:
- Pipeline health score — composite metric across stage discipline, deal signals, and data completeness
- Automated deal health signals — the 6 signals above detected per deal, with severity levels
- Stage velocity benchmarks — your actual average time per stage, with stall detection
- Warning dashboard — at-risk deals surfaced with the reason and recommended action
- Pipeline architecture audit — stage usage, exit criteria compliance, probability calibration
The analysis runs in minutes. You spend your time coaching reps and fixing deals, not building views and counting days.
Get your free pipeline health analysis at hubhorizon.io — connect your portal in 30 seconds, see your pipeline health score in under 5 minutes. No credit card required. View pricing plans for continuous monitoring, automated deal warnings, and exportable pipeline diagnostics.
Peter Sterkenburg is the founder of HubHorizon, a HubSpot portal health and optimisation platform. He's spent years in scale-up RevOps — redesigning pipelines, running the reviews, and eventually building the tool he wished he'd had.
Related articles
Your HubSpot Pipeline Is a Data Structure. Most Are Broken.
Your deal pipeline is a data structure. When stages, exit criteria, and required properties break, forecasting and AI produce garbage. Diagnose and fix it.
Read articleWhy Your HubSpot Sales Forecast Is Wrong — and It's Not a Process Problem
Most forecasting failures are data failures, not process failures. Diagnose and fix the data foundation your HubSpot forecast depends on.
Read articleThe HubSpot Sales Forecasting Cheat Sheet: Data, Process, and Pipeline in One Place
One-page HubSpot forecasting reference: 5 key deal properties, 3 methods compared, cadence templates, pipeline benchmarks, and a 10-question diagnostic.
Read article