The HubSpot Sales Forecasting Cheat Sheet: Data, Process, and Pipeline in One Place
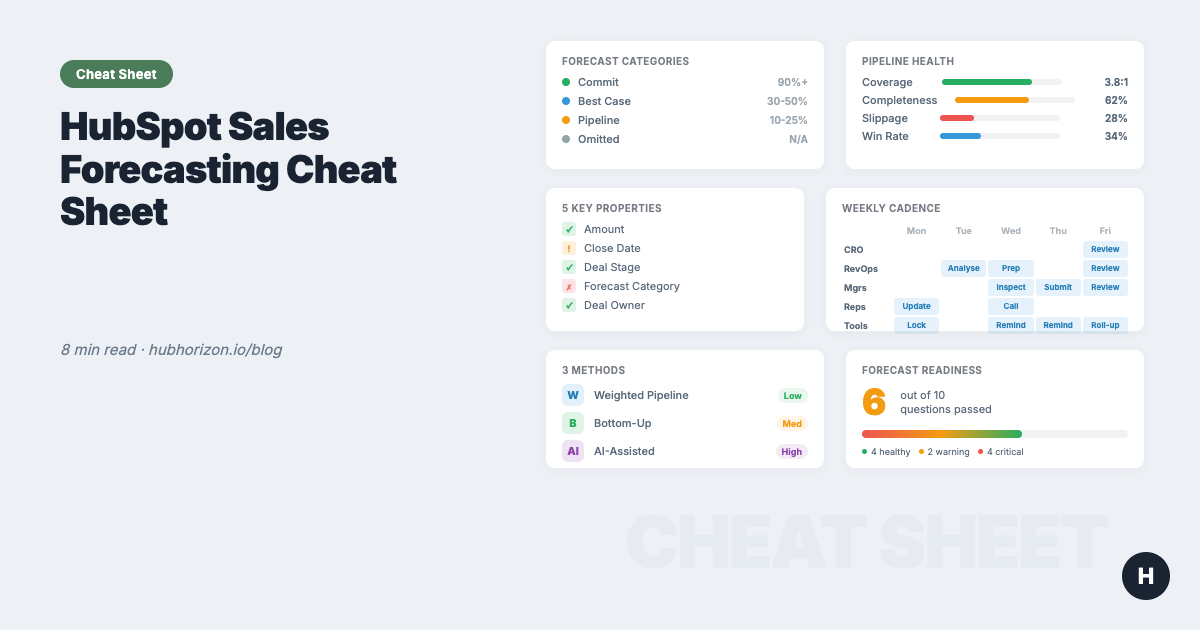
One-page HubSpot forecasting reference: 5 key deal properties, 3 methods compared, cadence templates, pipeline benchmarks, and a 10-question diagnostic.

Peter Sterkenburg
HubSpot Solutions Architect & Revenue Operations expert. 20+ years B2B SaaS experience. Founder of HubHorizon.
Why data quality comes first
You already know forecasting matters. Here's what happens when the data underneath it doesn't:
| Stat | Source |
|---|---|
| 25% of sales teams achieve >75% forecast accuracy | Korn Ferry |
| 53% of sales teams report poor CRM data quality | Gartner |
| 42% of sales teams still forecast in spreadsheets | Weflow pipeline data |
Those numbers aren't a coincidence. Poor data quality and poor forecast accuracy are the same problem wearing different hats. The full guide makes the argument in detail. This cheat sheet gives you the reference tables so you don't have to re-read the guide every quarter.
The 5 deal properties every forecast depends on
Every forecasting method — weighted, bottom-up, or AI — relies on these five fields. When they're missing or stale, the method doesn't matter.
| Property | Why it matters | What breaks without it | HubSpot implementation |
|---|---|---|---|
| Amount | Weighted forecast = probability x amount. Pipeline coverage depends on it. | Pipeline value is fiction. Coverage ratio is meaningless. | Required at stage gate (e.g., "Qualified" or later). Workflow to flag late-stage deals with $0. |
| Close date | Determines forecast period. Drives pacing. | Deals land in wrong quarter. Historical accuracy tracking impossible. | Track pushes. 3+ pushes = close date is fiction. |
| Deal stage | Probability weighting. Funnel analysis. | Weighted forecast uses wrong probabilities. | Define written exit criteria per stage. Audit quarterly. |
| Forecast category | Bottom-up roll-up (Commit / Best Case / Pipeline / Omitted). | Forecast tool shows partial data. Uncategorised deals are invisible. | Required update during weekly cadence. Use HubSpot's native tool. |
| Deal owner | Roll-up by rep, team, territory. | Orphan deals drop out of every roll-up. | Auto-assign via workflow. Monthly audit for missing/departed owners. |
Benchmark: >90% of open deals should have all five properties populated. Below 70% means your forecast is built on guesswork. For the full breakdown, see the 6 data quality dimensions.
Forecast categories in HubSpot
HubSpot's forecast tool uses four categories. Reps assign them per deal; managers review and adjust during the forecast cadence.
| Category | Definition | Expected win rate | When to assign |
|---|---|---|---|
| Commit | High confidence. Decision-maker confirmed, procurement timeline set, close plan documented. Only unpredicted changes prevent this from closing. | 90%+ | Deal has verbal or written commitment. Budget confirmed. Timeline agreed. |
| Best Case | Good momentum. Fully qualified, stakeholders engaged, but work remains. No commitment from economic buyer yet. | 30-50% | Proposal sent. Champion active. Decision timeline exists but isn't locked. |
| Pipeline | Active opportunity, still developing. Early-to-mid stage in the buying process. | 10-25% | Discovery complete. Need identified. No proposal or close plan yet. |
| Omitted | Not in the current forecast period. Deal is real but won't close this quarter/month. | N/A | Close date is beyond the forecast period, or deal is paused/stalled. |
The mistake I see everywhere: Reps put deals in "Commit" based on gut feeling. Define what "Commit" means in writing — the specific conditions that must be true — and enforce it during review calls. A commit without a documented close plan is a best case. Calling it a commit doesn't make it one.
Three forecasting methods at a glance
Most mature teams combine two or three methods. Start with one. Keep it simple. All three need the same data foundation underneath.
| Method | How it works | Complexity | Accuracy potential | Data requirements | HubSpot feature | HubSpot tier |
|---|---|---|---|---|---|---|
| Weighted pipeline | Stage probability x deal amount, summed across all deals | Low | Low-Medium | Amounts populated. Stages accurate. Probabilities reflect reality. | Default pipeline with probabilities | All tiers |
| Bottom-up (category) | Reps assign forecast categories. Managers adjust. Roll up to CRO. | Medium | High (when disciplined) | Categories assigned on every deal. Weekly review cadence. Manager adjustments tracked. | Forecast tool | Professional+ |
| AI-assisted | AI analyses historical patterns, deal velocity, and signals to project a number | High | Medium-High | 12+ months of clean closed-won data. Consistent stages. Activity data logged. | AI projections | Professional+ |
The punchline: All three methods fail the same way — when deal data is incomplete. A weighted forecast with missing amounts understates. A bottom-up with missing categories is blind. An AI model trained on dirty history is confidently wrong. Method choice matters less than data quality.
Making weighted probabilities dynamic
Most teams set stage probabilities once during pipeline setup and never touch them again. Your actual conversion rates shift as your market, team, and product change — the probabilities should shift with them.
| Stage | Typical default | What to use instead |
|---|---|---|
| Discovery / Qualification | 10-20% | Your actual last-12-month conversion rate from this stage to Closed Won |
| Demo / Evaluation | 20-35% | Same — pull from HubSpot pipeline reports |
| Proposal / Value Alignment | 35-60% | Same |
| Negotiation / Contract | 60-90% | Same |
| Closed Won | 100% | 100% |
Review and adjust these quarterly. Use HubSpot's pipeline stage conversion reports to see your actual rates — not the industry averages you guessed at during setup.
Forecast cadence templates
The right cadence depends on your sales cycle. Below are templates for three common motions.
SMB / High velocity (7-30 day cycle)
| Day | Who | Activity |
|---|---|---|
| Monday | RevOps / Tool | Pipeline snapshot. Flag data quality issues. Send pacing update. |
| Tuesday | Managers + Reps | Quick forecast check-in: update categories, flag slipped deals. |
| Thursday | Managers | Submit adjusted forecast. |
| Friday | Leadership | Weekly number review. Compare to target and pacing. |
Mid-market (30-90 day cycle)
| Day | Who | Activity |
|---|---|---|
| Monday | Forecast tool | Lock snapshot. Auto-send pacing report. |
| Tuesday | RevOps | Analyse pipeline changes. Formulate questions. Flag hygiene gaps. |
| Wednesday | Managers + Reps | Forecast call: inspect deals, update categories, adjust amounts/dates. |
| Thursday | Managers | Submit adjusted forecast. Document deal-level notes. |
| Friday | CRO + Managers + RevOps | Forecast review: compare to target, assess risk, agree actions. |
Enterprise (90+ day cycle)
| Week | Who | Activity |
|---|---|---|
| Week 1 Monday | RevOps | Biweekly pipeline analysis. Flag stage stagnation and slippage. |
| Week 1 Wednesday | Managers + Reps | Deep deal review: stage validation, stakeholder mapping, close plan audit. |
| Week 1 Thursday | Managers | Submit forecast with deal-level commentary. |
| Week 1 Friday | CRO + Managers + RevOps | Forecast review. |
| Week 2 | All | Execution week. Chase action items. Reps update deal data. RevOps monitors. |
Who does what:
| Role | Responsibility |
|---|---|
| Reps | Update deal data (amount, close date, stage, category) before each forecast call. |
| Managers | Review rep forecasts. Adjust categories based on deal inspection. Submit team roll-up. |
| RevOps | Monitor data quality. Surface pipeline insights. Challenge assumptions. Track accuracy. |
| CRO | Review aggregate forecast. Make resource allocation decisions. Hold teams accountable. |
Pipeline health benchmarks
These are the numbers I look at when assessing whether a portal's pipeline data can support an accurate forecast.
| Metric | How to calculate | Healthy | Warning | Critical |
|---|---|---|---|---|
| Pipeline coverage | Total pipeline value / revenue target | 3:1 - 5:1 | 2:1 - 3:1 | Below 2:1 |
| Deal data completeness | % of open deals with all 5 key properties | >90% | 70-90% | <70% |
| Stage conversion rate | Deals that progress to next stage / total deals in stage | Tracked and reviewed quarterly | Tracked but not reviewed | Not tracked |
| Average deal velocity | Days from creation to close (by pipeline/segment) | Known per segment, used for stall detection | Known but not actionable | Unknown |
| Slippage rate | % of deals with close date pushed 2+ times | <15% | 15-30% | >30% |
| Forecast category coverage | % of open deals with a forecast category assigned | >85% | 60-85% | <60% |
| Overdue deals | % of open deals with close date in the past | <5% | 5-15% | >15% |
| Win rate | Closed Won / (Closed Won + Closed Lost) by period | Known by segment and rep | Known overall only | Unknown or unreliable |
The coverage trap: A 5:1 ratio where 40% of deals have no amount is not a 5:1 ratio — it's an unknown ratio that happens to display as 5:1. Fix data completeness before optimising coverage. More on this in Your HubSpot Portal Has a Revenue Leak.
Is your pipeline forecast-ready? 10-question diagnostic
Answer honestly. Each question maps to a gap that will show up in your forecast numbers.
- 1. Deal amounts: >90% of open deals past qualification have an amount populated
- 2. Forecast categories: >85% of open deals have a forecast category assigned
- 3. Close date freshness: <5% of open deals have a close date in the past
- 4. Close date stability: Average close date pushes per deal is <2
- 5. Association quality: >85% of deals are associated to at least one contact AND one company
- 6. Stage probabilities: Reviewed and updated based on actual conversion rates in the last 12 months
- 7. Pipeline coverage: You know your coverage ratio and review it weekly
- 8. Forecast cadence: A defined review rhythm exists (weekly or biweekly) and is followed
- 9. Historical data: Win rates by stage and segment are available for the last 12 months
- 10. Deal velocity: Average time-in-stage and overall cycle length are known per pipeline
8-10 checked: Your data foundation is solid. Time to optimise methodology and intelligence.
5-7 checked: Directionally right, but you'd hesitate to bet your job on it. Fix data gaps first.
Below 5: Your forecast is a guess with extra steps. Start with data completeness — questions 1-5 — before spending on process or tools.
For a broader view beyond deal data, a CRM health score rolls signals across all objects into a single composite metric.
Common pitfalls and HubSpot-native fixes
| # | Pitfall | What goes wrong | HubSpot fix |
|---|---|---|---|
| 1 | No required fields on deals | Reps create deals with just a name. Amount, close date, and stage are empty. Forecast has nothing to work with. | Make Amount and Close Date required at a specific stage gate via conditional property logic or workflow-based validation. Don't require everything upfront — require it when it matters. |
| 2 | Stage exit criteria undefined | Reps move deals forward based on activity, not buyer milestones. Stages don't mean what they should. | Write exit criteria for each stage. What must the buyer have done? Train reps. Audit during forecast calls. Use HubSpot Playbooks to guide stage updates. |
| 3 | Forecast categories ignored | The forecast tool shows a partial picture because 30-40% of deals have no category. Bottom-up method is blind. | Add category review to your weekly cadence. If a deal has no category, it gets flagged in the forecast meeting. Make it a simple cultural expectation, not a system enforcement. |
| 4 | Close dates never updated | Deals show optimistic close dates from three months ago. Current-quarter pipeline includes deals that should be next quarter. | Track overdue deals in a saved view. Review weekly. Require a reason when close dates push beyond 30 days. Consider a workflow that alerts the manager when a close date passes without a stage change. |
| 5 | Pipeline zombies | Deals that stopped moving months ago still sit in the pipeline, inflating coverage and distorting stage distribution. | Define a "stale deal" threshold per pipeline (e.g., no activity in 45 days for mid-market). Build a workflow to flag or auto-close stale deals. Review during monthly pipeline hygiene. |
| 6 | Probabilities set once, never updated | Stage probabilities from initial setup don't reflect actual conversion rates. Weighted forecast is systematically wrong. | Pull actual stage-to-close conversion rates from HubSpot pipeline reports quarterly. Update probabilities to match reality. Consider running two weighted forecasts: one with current probabilities and one with last-quarter actuals. |
| 7 | Spreadsheet forecasting | Forecast lives in a spreadsheet that doesn't sync back to HubSpot. Two sources of truth. Numbers diverge by week 2. | Use HubSpot's native forecast tool. It reads directly from deal data, tracks changes, and maintains a single source of truth. If you need more advanced forecasting, use a tool that integrates with HubSpot (Forecastio, Clari, etc.) rather than a disconnected spreadsheet. |
| 8 | No forecast accuracy tracking | Nobody compares the forecast to actual outcomes. The same errors repeat quarter after quarter. | Snapshot your forecast at period boundaries. Compare to actual closed-won when the period ends. Track accuracy by rep, team, and category. HubSpot's forecast tool retains snapshots; build a dashboard to visualise accuracy trends. |
Left alone, these compound as technical debt. Fix the process that creates the problem, not the symptoms.
Related resources
| Resource | What it covers |
|---|---|
| Why Your HubSpot Sales Forecast Is Wrong | Full guide: the forecasting data stack, methodology comparison, cadence design, pipeline coverage, deal slippage |
| The HubSpot Data Hygiene Cheat Sheet | Data quality across all objects: 6 dimensions, object-level best practices, 30-day quick wins |
| Your HubSpot Portal Has a Revenue Leak | Where revenue leaks hide: orphan records, property sprawl, broken associations |
| CRM Health Scores Explained | What composite health scores measure and how to improve them |
| HubSpot Data Quality Audit Guide | 10-area audit checklist for HubSpot portals |
| RevOps Maturity Model | 5-level maturity framework: where does your portal stand? |
| AI Readiness for HubSpot | Data requirements for Breeze AI features, including AI-assisted forecasting |
| Building a Unified Customer View | Why associations matter: deals, contacts, companies connected |
| Escaping the RevOps Firefighting Trap | Prioritising foundations over quick fixes |
Automate the diagnostic
You can calculate all of this by hand. Pull deal reports, count empty fields, track overdue dates in a spreadsheet. It works, and it'll take you a day or two per quarter.
HubHorizon does the same thing in minutes: forecasting readiness score, pipeline health dashboard, deal slippage detection, and accuracy tracking over time. Connect your portal, get the numbers, skip the spreadsheet.
Free forecasting readiness analysis at hubhorizon.io — 30 seconds to connect, first score in under 5 minutes. No credit card. Pricing for ongoing monitoring and exportable reports.
Peter Sterkenburg built HubHorizon after years in scale-up RevOps — running the forecast calls, staring at the pipeline gaps, and eventually building the diagnostic tool he wished someone else had made.
Related articles
The HubSpot Pipeline Management Cheat Sheet: Views, Signals, and Reviews in One Place
One-page HubSpot pipeline reference: 6 deal health signals, warning thresholds, 9 saved view recipes, stage design checklist, and review prep guide.
Read articleYour HubSpot Pipeline Is a Data Structure. Most Are Broken.
Your deal pipeline is a data structure. When stages, exit criteria, and required properties break, forecasting and AI produce garbage. Diagnose and fix it.
Read articleWhy Your HubSpot Sales Forecast Is Wrong — and It's Not a Process Problem
Most forecasting failures are data failures, not process failures. Diagnose and fix the data foundation your HubSpot forecast depends on.
Read article