How to Calculate Your HubSpot Data Quality Score (With Benchmarks)
How HubSpot data quality scores work: the 7-component framework, benchmarks by portal size, and steps to improve your score.

Peter Sterkenburg
HubSpot Solutions Architect & Revenue Operations expert. 20+ years B2B SaaS experience. Founder of HubHorizon.
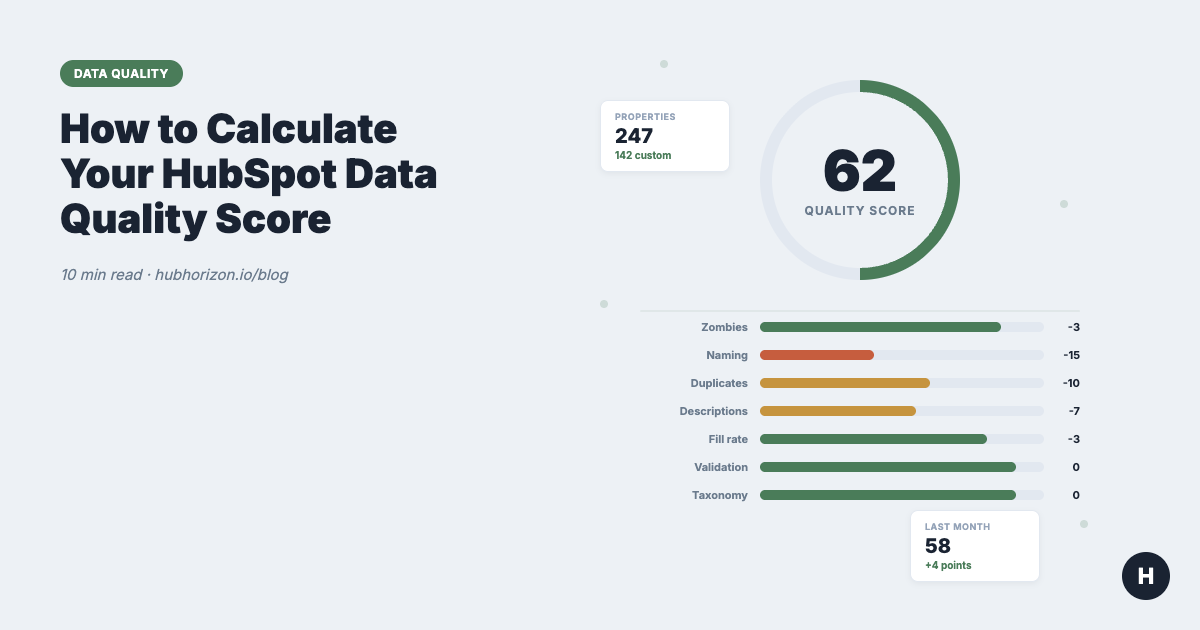
I ran our analysis on a 3-year-old HubSpot portal last month. The client was confident their data was "pretty clean." Their score came back at 38.
The look on the RevOps lead's face was something between confusion and mild horror. "We have 200 custom properties," she said. "How bad can it be?"
Turns out: 47 of those properties hadn't been updated in over a year. 31 had no descriptions. 12 had naming issues severe enough to confuse reporting. And there were 8 probable duplicate groups — properties that tracked the same thing under different names.
That's what a data quality score surfaces. Not the obvious problems (you already know about those), but the structural decay that accumulates so slowly you don't notice until it's everywhere.
What is a data quality score?
A data quality score is a single number (0-100) that represents how clean and well-organised your HubSpot property data is. It's calculated per CRM object (contacts, companies, deals, tickets) and then aggregated into a portal-level score.
This is different from a CRM health score, which is a broader concept covering data quality, configuration, adoption, and process effectiveness. A data quality score is specifically about the properties themselves — their structure, naming, usage, and documentation.
Think of it this way: your CRM health score is your annual physical. Your data quality score is the blood work — it measures the specific markers that tell you whether the system is healthy at a structural level.
The 7 components
Every data quality score we calculate starts at 100 and deducts for problems. Each component has a maximum penalty, so one bad area can't tank your entire score. Here's what we measure and why.
1. Zombie properties (max -20 points)
Zombie properties are custom properties that haven't been updated on any record in 365 or more days. They're still there, cluttering your property lists and adding noise to every export and report.
The deduction is proportional. If 10% of your custom properties are zombies, you lose a few points. If 50% are zombies, you lose the full 20.
Why this matters: Every zombie property is one more thing your team has to scroll past, one more option in a filter that returns nothing, and one more field that integration tools try to map. I've seen portals with 400+ custom properties where fewer than 100 were actually in use. That's not a CRM — that's an archaeological dig.
How to fix it: Run a property hygiene audit. Export your properties, sort by last updated date, and archive anything untouched for a year. If you're nervous about deleting, move them to a "Deprecated" group first and wait 90 days.
2. Naming convention issues (max -25 points)
Naming conventions are the largest single penalty because inconsistent naming causes the widest range of downstream problems. The score checks for:
- Mixed casing patterns (some properties use
snake_case, others usecamelCase, others useTitle Case) - Missing prefixes or namespaces (no way to tell which team or integration created a property)
- Ambiguous names (
status,type,category— status of what?) - Excessively long names that get truncated in reports
- Special characters that break integrations
High-severity naming issues (ambiguous names, mixed conventions) penalise more than low-severity ones (slightly long names).
Why this matters: Naming conventions are the taxonomy of your CRM. When they're inconsistent, reports become unreliable and automations break in ways that are hard to debug. New team members waste hours trying to figure out which of three similarly-named properties is the "real" one. If you're evaluating your portal's AI readiness, naming quality is one of the first things AI tools struggle with — they rely on semantic names to understand what data means.
How to fix it: Adopt a convention and enforce it. Most teams use snake_case with a prefix: sales_qualified_date, mkt_lead_source, cs_health_status. Document it. Then rename the worst offenders. The property naming conventions section of the hygiene guide walks through this.
3. Duplicate properties (max -25 points)
Duplicate detection looks for property groups that likely track the same data under different names. This uses multiple signals: name similarity, description overlap, field type matching, option value overlap, and value correlation across records.
Each duplicate group is weighted by confidence. A high-confidence duplicate (two properties with near-identical names, same field type, and correlated values) penalises more than a possible overlap flagged on name similarity alone.
Why this matters: Duplicates cause more damage than most people realise. Sales enters data in lead_source. Marketing uses original_source. Neither team knows the other property exists, so neither trusts the data, so both create workarounds. Multiply that by a few years and you have dozens of shadow properties that fragment your reporting.
How to fix it: You can't just delete one of the duplicates — you need to decide which property to keep, migrate the data, update workflows and reports that reference the deprecated one, and then remove it. This is the hardest fix in the list, which is why it carries the highest maximum penalty alongside naming.
4. Missing descriptions (max -15 points)
Every custom property should have a description that explains what it stores, who uses it, and when it gets updated. The score penalises properties with empty or missing description fields.
Why this matters: Descriptions are your data dictionary. Without them, every new team member has to guess what cs_nps_override means. Integrations can't be configured correctly. And when someone eventually audits the portal, they can't tell whether a property is critical or abandoned without investigating each one individually.
How to fix it: This is the easiest problem to solve — it's just writing. Block out two hours, pull up your custom properties, and write a one-sentence description for each. Start with the ones your team uses daily.
5. Low fill rate (max -15 points)
Fill rate measures what percentage of records actually have a value for each property. A property with a 2% fill rate across 10,000 contacts is either not being used, not being enforced, or targeting the wrong object.
Why this matters: Low fill rates mean your segments are unreliable and your automations skip most of your records. If you're building data quality dimensions into your governance framework, fill rate is one of the most actionable metrics — it tells you exactly where data collection is failing.
How to fix it: For each low-fill property, ask: should this property be required? Is it on the right forms? Is the team trained to fill it in? Sometimes the answer is that the property isn't needed — in which case, archive it and reclaim the points from both this component and the zombie component.
6. Validation coverage (max -10 points)
Validation checks whether properties that should have input constraints actually do. Email fields should validate format. Date fields should use date pickers, not free text. Dropdown options should be defined, not open-ended.
The score compares your properties against expected validation rules for their type and penalises gaps.
Why this matters: Unvalidated properties let bad data in at the point of entry. A phone number field without formatting validation will contain everything from +44 20 7946 0958 to call me after 3pm. That inconsistency propagates through every report, automation, and integration that touches the field.
How to fix it: Review your text-based properties and convert appropriate ones to structured types (dropdowns, date pickers, number fields). Add validation rules to the ones that must remain text. HubSpot's built-in validation options are limited, but they cover the basics.
7. Taxonomy organisation (max -5 points)
Taxonomy checks whether properties that belong to the same logical family are grouped together in HubSpot's property groups. If you have sales_qualified_date in "Sales Properties" but sales_qualified_reason in "Contact Information," that's a taxonomy disorder.
Why this matters: Disorganised taxonomy makes the property list harder to navigate and suggests properties are being created ad hoc. It's a small penalty because the impact is mostly about usability rather than data integrity, but it correlates with bigger problems elsewhere.
How to fix it: Reorganise your property groups to match your team structure or data domains. Most portals benefit from groups like: Sales, Marketing, Customer Success, Product/Usage, Integration Data, and Deprecated.
Benchmarks: what's a good score?
We've analysed hundreds of HubSpot portals. Here's what we see:
| Score Range | Rating | What it means | Typical portal |
|---|---|---|---|
| 80-100 | Excellent | Well-governed, regularly maintained | Portals with dedicated RevOps, <2 years old, or recently audited |
| 65-79 | Good | Minor issues, mostly cosmetic | Established portals with some governance process |
| 50-64 | Fair | Structural problems present | 2-4 year old portals with multiple teams creating properties |
| 35-49 | Poor | Serious data quality issues | Portals that have never been audited, post-migration portals |
| 0-34 | Critical | Major cleanup needed | Legacy portals, multiple failed migrations, no governance |
Benchmarks by portal size
Portal size affects scores more than most people expect. Larger portals tend to score lower — not because they're managed worse, but because property sprawl is a natural consequence of growth.
| Portal Size | Median Score | Common Issues |
|---|---|---|
| <100 custom properties | 72 | Missing descriptions, no naming convention |
| 100-250 custom properties | 58 | Duplicates emerge, zombie accumulation begins |
| 250-500 custom properties | 48 | Naming chaos, integration property sprawl |
| 500+ custom properties | 41 | All of the above, plus taxonomy disorder |
If your portal has 300+ custom properties and scores above 60, you're doing better than most.
How to improve your score
The 7 components aren't equally easy to fix. Here's the order I recommend, from quickest impact to most involved:
Week 1: Descriptions and zombies. Writing descriptions takes a few hours and reclaims up to 15 points. Archiving zombie properties is mechanical and reclaims up to 20 points. These two alone can move a score from 45 to 70.
Week 2: Fill rates. Investigate your low-fill properties. For each one, decide: enforce it (add to forms, make required), fix the data (backfill from another source), or archive it. Reclaims up to 15 points.
Week 3: Naming and taxonomy. Rename the worst offenders (high-severity naming issues first). Reorganise property groups. This is more disruptive because renaming internal names affects workflows and integrations. Reclaims up to 30 points.
Week 4+: Duplicates. This is the long game. Each duplicate group needs investigation, a merge plan, data migration, and downstream cleanup. Start with high-confidence duplicates. Reclaims up to 25 points.
Data quality score vs CRM health score vs AI readiness score
These three scores measure different things:
| Score | What it measures | Scope | Use case |
|---|---|---|---|
| Data quality score | Property structure and hygiene | Properties only | "Is our data well-organised?" |
| CRM health score | Overall CRM effectiveness | Data + config + adoption | "Is our CRM helping or hurting?" |
| AI readiness score | Readiness for AI/ML tools | Data + structure + completeness | "Can AI work with our data?" |
The data quality score feeds into both the CRM health score and the AI readiness score. You can have low data quality and still have decent CRM adoption (people use the system, they just use it inconsistently). But you can't have high AI readiness with low data quality — AI tools need well-named, well-structured properties to make sense of what they're reading.
Scores are snapshots — trends are what matter
A score is useful. A trend is better. The real value isn't knowing you're at 52 today — it's knowing whether you were at 45 last quarter and are moving in the right direction, or whether you were at 60 and things are getting worse.
That's why we built HubHorizon to recalculate monthly and show you the trend. A single audit tells you where you are. Continuous monitoring tells you whether your governance is working.
If you haven't measured your data quality score yet, the first step is running a data quality audit. Whether you use our tool or do it manually, measuring is what starts the improvement.
Frequently Asked Questions
What is a good HubSpot data quality score?
A score above 70 indicates a well-maintained portal. Most portals fall between 40 and 65. Portals with dedicated RevOps teams and regular auditing processes typically score 75+. The score is relative to your property count — a portal with 500 custom properties scoring 60 is better-governed than one with 50 properties scoring 65, because property sprawl makes hygiene harder at scale.
How is the data quality score different from HubSpot's built-in data health tools?
HubSpot's Data Quality Command Center (available on Professional and Enterprise tiers) focuses on operational issues: duplicate records, formatting inconsistencies, and property anomalies. It doesn't produce a composite score, doesn't assess naming conventions or taxonomy, and doesn't track trends over time. A data quality score aggregates 7 dimensions into a single metric you can monitor month-over-month. The two are complementary — use HubSpot's native tools for record-level fixes and a data quality score for portal-level governance.
How often should I check my data quality score?
Monthly is the sweet spot for most teams. Checking weekly is too frequent — property-level changes don't happen that fast. Checking quarterly means you miss drift. Monthly scoring catches problems early enough to fix them before they compound. If you've just completed a major cleanup, check again after 30 days to confirm the improvements held.
Can I calculate a data quality score manually?
In theory, yes. You'd need to export all your custom properties, check each one for usage, naming consistency, descriptions, fill rates, and duplicates, then apply weighted deductions. In practice, this takes 8-12 hours for a portal with 200+ properties. The data quality audit guide explains the manual process. Automated tools like HubHorizon calculate it in under 5 minutes.
Get your free data quality score at hubhorizon.io — connects via OAuth, analyses your properties, and returns your score with a breakdown of all 7 components. No credit card required. View pricing plans for continuous monitoring and full diagnostics.
Peter Sterkenburg is the founder of HubHorizon, a continuous portal health analysis platform for HubSpot. He builds the scoring algorithms that power the data quality diagnostics and spends too much time thinking about property naming conventions.
Related articles
The HubSpot Pipeline Management Cheat Sheet: Views, Signals, and Reviews in One Place
One-page HubSpot pipeline reference: 6 deal health signals, warning thresholds, 9 saved view recipes, stage design checklist, and review prep guide.
Read articleYour HubSpot Pipeline Is a Data Structure. Most Are Broken.
Your deal pipeline is a data structure. When stages, exit criteria, and required properties break, forecasting and AI produce garbage. Diagnose and fix it.
Read articleWhy Your HubSpot Sales Forecast Is Wrong — and It's Not a Process Problem
Most forecasting failures are data failures, not process failures. Diagnose and fix the data foundation your HubSpot forecast depends on.
Read article