How to Quantify RevOps Impact for Leadership
Five metrics that prove RevOps ROI to leadership: pipeline velocity, win rate, revenue per employee, time-to-revenue, and forecast accuracy.

Peter Sterkenburg
HubSpot Solutions Architect & Revenue Operations expert. 20+ years B2B SaaS experience. Founder of HubHorizon.
A RevOps manager I know spent three months fixing her company's HubSpot portal. Cleaned up duplicate properties, automated lead routing that was being done manually, rebuilt the pipeline stages to match how reps actually sell, and fixed association gaps that were breaking their account-based reporting. The CRM ran noticeably better. Reps stopped complaining about data entry friction. Marketing campaigns started hitting the right segments.
Then the CFO asked at the quarterly business review: "What's the ROI of the RevOps function?"
She had stories. The workflow she fixed that was assigning leads to a rep who left six months ago. The 200 duplicate contacts she merged. The pipeline stage she removed because every rep skipped it. All real improvements. None of them translated into the number the CFO wanted.
She told me afterwards: "I know we're more efficient. I just can't prove it in their language."
That's the gap this article fills. Not more KPIs to track. A framework for proving that RevOps work creates measurable business value, in the language that CFOs, CEOs, and board members actually use.
The measurement problem
RevOps is hard to quantify because it improves infrastructure, not revenue directly. A sales rep closes a deal. Marketing generates a lead. Customer success renews an account. The contribution is visible. RevOps fixes the data quality that made the lead routable, the pipeline structure that made the forecast accurate, the automation that removed three manual steps from the handoff. The contribution is real but indirect.
Salesloft's 2025 Wakefield research (400 US respondents across manufacturing, telco, finance, and tech) found that 89% of RevOps functions lack clearly defined strategic goals. The field is split exactly 50/50 between people who view RevOps as strategic and people who view it as reactive support. And 79% still categorise it as sales-adjacent, even though RevOps teams report working most closely with COOs (26%), CEOs (25%), and CFOs (24%).
That's the measurement problem in data form: the function reports to the C-suite but can't articulate its value in C-suite terms.
The result is what I described in the RevOps technical debt article: "our data needs work" gets a nod and no action because it doesn't translate to dollars. Meanwhile, Salesforce's State of Sales found that reps spend only 28-30% of their time actually selling (5,500 respondents globally). RevOps exists to improve that ratio. But "we helped reps sell more" isn't a number.
The fix isn't tracking more metrics. It's tracking the right ones, in a format leadership already understands.
Five metrics that leadership actually cares about
Every RevOps metrics guide lists 20-30 KPIs. That's analysis paralysis for an executive audience. Leadership wants to know five things: are we growing efficiently, are we winning enough, are we getting faster, can we trust our forecast, and what changed since last quarter.
Five metrics answer those questions. Each one can be pulled from HubSpot data.
1. Pipeline velocity (the single best RevOps metric)
Formula: (Number of Opportunities × Average Deal Value × Win Rate) / Sales Cycle Length
Pipeline velocity collapses four variables into one number: how many dollars your pipeline generates per day. It's the single metric that captures whether RevOps work is actually moving the revenue engine forward.
Pull it from HubSpot: deal count from your pipeline report, average deal amount, win rate from closed deals, and average days to close. If you improve any of the four inputs, velocity goes up. That means every RevOps project — data cleanup, process automation, better qualification criteria — can be tied to a velocity change.
OpsEthic's research found that companies tracking pipeline velocity weekly grow 34% faster than those that don't. That's not because the metric itself causes growth. It's because weekly measurement creates a feedback loop: you see the impact of changes within days, not quarters.
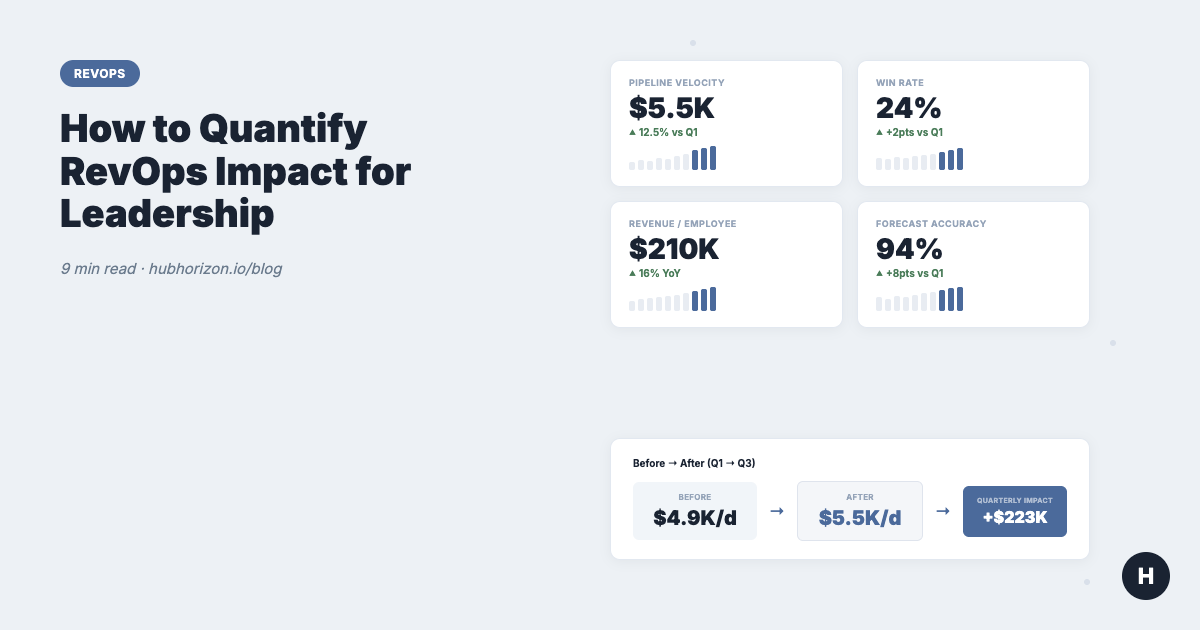
Example: A 150-person SaaS company has 80 deals in pipeline, $25K average value, 22% win rate, and a 90-day sales cycle. Their velocity is $4,889/day. If RevOps work reduces the sales cycle by 10 days (better routing, cleaner handoffs, fewer data entry steps), velocity jumps to $5,500/day. That's a 12.5% improvement worth an additional $223K per quarter. That's the number the CFO wants.
2. Win rate trajectory
Formula: Closed Won / (Closed Won + Closed Lost) × 100
Win rate is a lagging indicator, but the trend is where RevOps impact shows up. A rising win rate quarter over quarter signals better qualification, better data, and better process. A falling win rate despite strong pipeline signals systemic problems that RevOps should be fixing.
The connection to data quality is direct. Openprise's 2025 survey found that 70% of RevOps teams can't make strategic decisions because of poor data quality. When reps work with incomplete data quality dimensions — missing industry fields, broken company associations, stale contact information — they pursue deals they shouldn't and miss signals on deals they should.
Clean data improves qualification. Better qualification improves win rates. Track the trajectory, not the absolute number, and connect improvements to the specific data and process changes you made.
3. Revenue per employee
Formula: Total Revenue / Headcount
This is the efficiency metric that boards and investors watch. It answers: "as we hire, are we getting more productive or less?"
Boston Consulting Group found that top B2B companies implementing RevOps report 10-20% increases in sales productivity, 100-200% increases in digital marketing ROI, and 30% reduction in go-to-market expenses. Revenue per employee captures the net effect of all of this.
The metric is powerful because it's hard to argue with. If revenue per employee was $180K last year and $210K this year, something improved. RevOps can attribute the gain to specific projects: "We automated lead routing, which eliminated 4 hours per rep per week. We cleaned up the pipeline, which reduced forecast churn. We fixed the data feeding our scoring model, which improved lead quality." The revenue per employee number is the proof. The project list is the explanation.
4. Time-to-revenue
How long from first touch to closed deal?
Time-to-revenue isn't a standard HubSpot report, but you can build it from lifecycle stage timestamps. Measure the average number of days from contact creation (or first conversion) to deal closed-won. Then break it into stage transitions: how long from MQL to SQL? SQL to opportunity? Opportunity to closed-won?
Every day reduced is compound value. A company closing $2M per quarter with a 90-day cycle that reduces it to 75 days doesn't just get deals faster. They fit more deals into the same period. The firefighting trap article covers why this matters operationally: systematic process improvements (what RevOps builds) produce faster handoffs than reactive, ad-hoc routing.
HubSpot benchmarks help contextualise your number. HubSpot's research puts the average SaaS sales cycle at 84 days. Under $5K ACV, it's closer to 40 days. Over $100K ACV, it stretches to 170 days. If your cycle is significantly longer than these benchmarks for your deal size, there's a RevOps improvement opportunity, and reducing it is a metric leadership will care about.
5. Forecast accuracy
Formula: Actual Revenue / Forecasted Revenue × 100
This is the trust metric. CFOs build budgets, hiring plans, and cash flow projections on revenue forecasts. When forecasts are consistently wrong, everything downstream is wrong too. That's why forecast accuracy often matters more to the C-suite than the other four metrics combined.
The connection to RevOps is direct: your forecast is only as good as the data it's built on. When deal amounts are missing, close dates are stale, and pipeline stages don't match reality, forecasts become fiction. The sales forecasting data quality article covers this in depth. A data governance policy that enforces deal field completion is the upstream fix.
The Salesloft/Wakefield research found that 97% of RevOps teams report measurable ROI, with the strongest gains in forecasting accuracy and predictive analytics. That's not a coincidence. Forecast accuracy is the most visible metric because leadership looks at it every month.
The before-and-after framework
Research numbers are useful for establishing that RevOps works in general. They don't prove that your RevOps function is delivering value. For that, you need your own numbers.
The framework is simple: measure before, change something, measure after.
Step 1: Establish your baseline. Before starting a project, record the current state of the five metrics above. If you're already mid-project, reconstruct the baseline from historical HubSpot data (deal reports from last quarter, lifecycle stage timestamps, prior forecasts vs actuals).
Step 2: Execute and track. Run your project — data cleanup, workflow automation, pipeline restructure, whatever it is. While it's running, track the same metrics monthly.
Step 3: Present the delta. Don't present absolute numbers without context. Present the change.
Example: "Pipeline velocity was $4,889/day in Q1. After data cleanup and lead routing automation in Q2, it's $5,500/day in Q3. That's a 12.5% improvement, which translates to an additional $223K per quarter in pipeline throughput."
That sentence has everything a CFO needs: the metric, the before, the after, the change, and the dollar impact. The project description explains why it changed. The number proves that it did.
Forrester's research shows that aligned revenue teams achieve 36% more revenue growth and 28% more profitability. Your before-and-after data tells the same story at the scale of your company.
What leadership actually asks
Different executives care about different things. Match your metrics to their questions.
| Executive | Their question | Your metric | Your answer format |
|---|---|---|---|
| CFO | "What's the ROI?" | Revenue per employee, LTV:CAC trend | "Revenue per employee increased 16% YoY. Here's what changed." |
| CEO | "Are we scaling efficiently?" | Revenue per employee, pipeline coverage | "We added 30 people and revenue per employee still grew." |
| CRO | "Will we hit the number?" | Pipeline velocity, forecast accuracy, win rate | "Coverage ratio is 3.2x target. Forecast accuracy was 94% last quarter." |
| Board | "How do we compare?" | Benchmark comparisons | "Our sales cycle is 72 days vs 84-day industry average." |
The CRM health score can serve as a supporting metric in these conversations. It won't appear on a board slide, but it gives you a single number that tracks whether the data foundation is improving or degrading over time.
Building the RevOps dashboard
Two rules for RevOps dashboards that actually get used:
Rule 1: 2-5 metrics per audience. The executive dashboard has 5 metrics. The ops team dashboard has more detail. Don't combine them. A CFO doesn't need to see MQL-to-SQL conversion rates. A demand gen manager doesn't need revenue per employee.
Rule 2: Leading indicators for operational meetings, lagging indicators for quarterly reviews. Pipeline velocity and coverage ratio are leading indicators — they predict the future. Revenue per employee and win rate are lagging indicators — they confirm what happened. Use leading indicators in weekly ops meetings where you can still change the outcome. Use lagging indicators in quarterly reviews where you're reporting results.
Build your dashboard in HubSpot reporting where possible. The advantage of pulling from the same system that reps use daily is that nobody can argue the data comes from a different source. Codify your definitions first: what counts as an "opportunity"? At what stage does a deal enter the pipeline? When is a deal "stale"? The RevOps maturity model describes this as the shift from Level 2 (inconsistent definitions) to Level 3 (documented, shared standards).
If your data quality is low, fix the data first. A dashboard built on incomplete fields produces metrics nobody trusts, which is worse than no dashboard at all. Start with a data quality audit to establish where you stand, and build the business case for cleanup using the same before-and-after framework described above.
Frequently Asked Questions
What is the ROI of RevOps?
Forrester research shows that companies with aligned revenue teams achieve 36% more revenue growth and 28% more profitability. Boston Consulting Group found 10-20% increases in sales productivity and 30% reduction in go-to-market expenses. Salesloft's 2025 Wakefield study (400 respondents) found that 97% of RevOps teams report measurable ROI, with the strongest gains in forecasting accuracy and operational efficiency. Public companies with dedicated RevOps functions saw 71% higher stock performance (Clari).
What metrics should RevOps track for leadership?
Five metrics cover what leadership cares about: pipeline velocity (how many dollars per day your pipeline generates), win rate trajectory (whether conversion is improving), revenue per employee (whether you're scaling efficiently), time-to-revenue (how fast you convert leads to closed deals), and forecast accuracy (whether leadership can trust your projections). Each can be pulled from HubSpot deal and lifecycle data.
How do you present RevOps impact to a CFO?
Use the before-and-after framework: measure your baseline metrics before a project, execute, then present the delta with a dollar figure attached. "Pipeline velocity was $4,889/day in Q1. After data cleanup, it's $5,500/day in Q3 — a 12.5% improvement worth $223K per quarter." CFOs want numbers, not stories. Use your own data, not industry averages, and connect the improvement to specific projects.
How many metrics should a RevOps dashboard have?
Two to five per audience. The executive dashboard shows 5 metrics maximum. The ops team dashboard shows more detail. Use leading indicators (pipeline velocity, coverage ratio) in weekly operational meetings where you can still change the outcome. Use lagging indicators (revenue per employee, win rate) in quarterly reviews where you're reporting results.
Get your data quality baseline at hubhorizon.io — you can't measure RevOps impact without accurate data. See your fill rates, association gaps, and composite scores in under 5 minutes. View pricing plans for continuous monitoring that tracks whether your operational improvements are sticking.
Peter Sterkenburg is the founder of HubHorizon, a portal health platform for HubSpot. He's been the RevOps person who couldn't explain ROI to the CFO, which is why he built a tool that gives you the numbers.
Related articles
The HubSpot Pipeline Management Cheat Sheet: Views, Signals, and Reviews in One Place
One-page HubSpot pipeline reference: 6 deal health signals, warning thresholds, 9 saved view recipes, stage design checklist, and review prep guide.
Read articleYour HubSpot Pipeline Is a Data Structure. Most Are Broken.
Your deal pipeline is a data structure. When stages, exit criteria, and required properties break, forecasting and AI produce garbage. Diagnose and fix it.
Read articleWhy Your HubSpot Sales Forecast Is Wrong — and It's Not a Process Problem
Most forecasting failures are data failures, not process failures. Diagnose and fix the data foundation your HubSpot forecast depends on.
Read article